Settings give you the control of the data displayed. Data displayed in different views (table or chart) will have different settings.
SETTING > DECIMALS 0, 1, 2 (For Table)
By launching Decimal 0, 1, or 2 options under Settings, you can choose to display data in the format of a whole number, one decimal point or two decimal points, respectively.
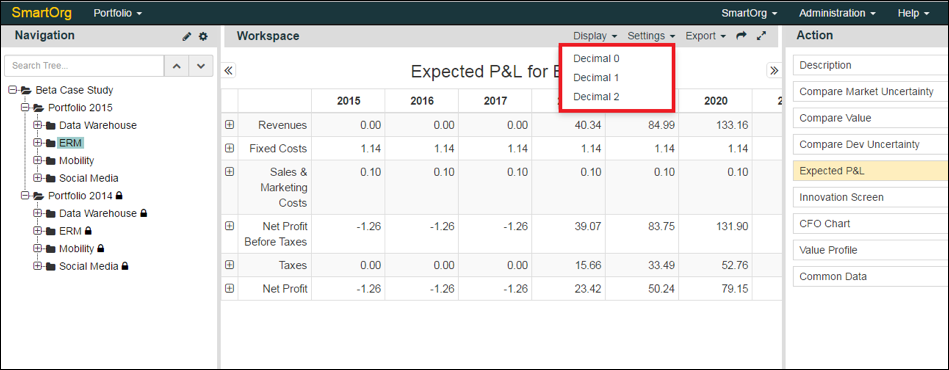
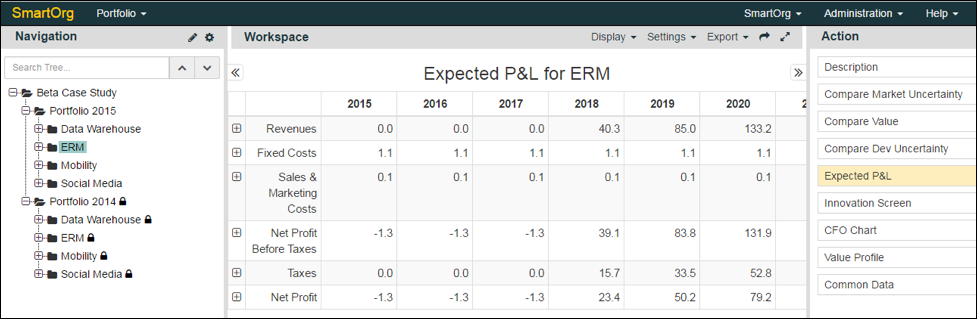
Figure Displaying: One Decimal Point
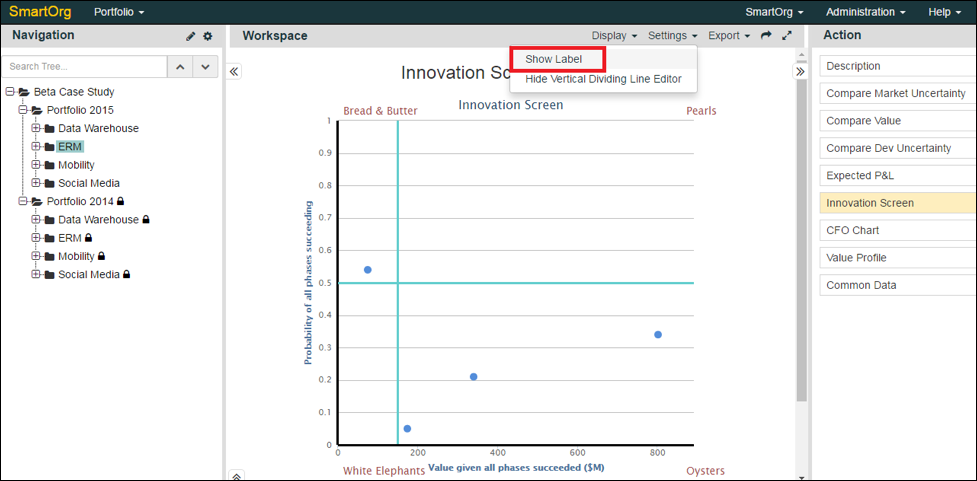
SETTINGS > SHOW LABEL (FOR INNOVATION SCREEN)
This feature is specifically for the Innovation Screen Action Page. In the Workspace area, where the Chart for Innovation is shown, you can choose to show labels for all the projects shown by different scatter plots on the screen by selecting Show Labels under Settings Menu.
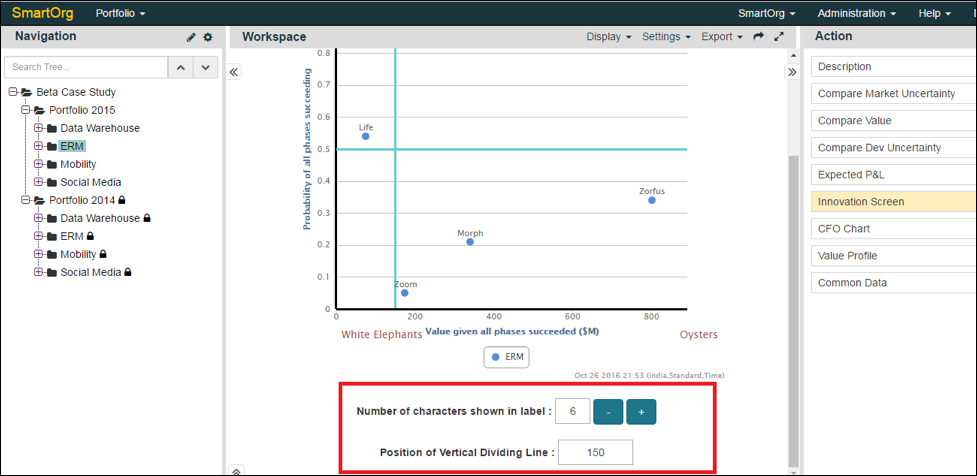
As you scroll down this workspace window, you can see the option to increase the number of characters to shown for the Label as well as you can choose what number to set the Vertical Dividing Line at. For more information about how to use innovation screen, please refer to HOW DO YOU HOLD PEOPLE ACCOUNTABLE FOR PORTFOLIO/PROJECT DECISIONS WHEN THINGS ARE UNCERTAIN?
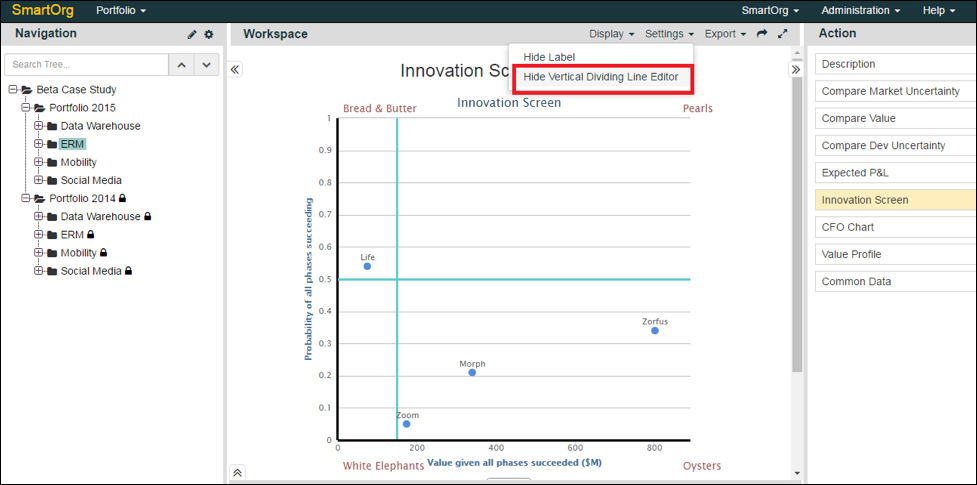
SETTINGS > HIDE VERTICAL DIVIDING LINE EDITOR (FOR INNOVATION SCREEN)
To hide the vertical dividing line position editor, in the Innovation Screen, you can choose the option ‘Hide Vertical Dividing Line Editor’ under the Settings Menu. This will allow the vertical line to be set in one fixed place and not allow anyone to change it.
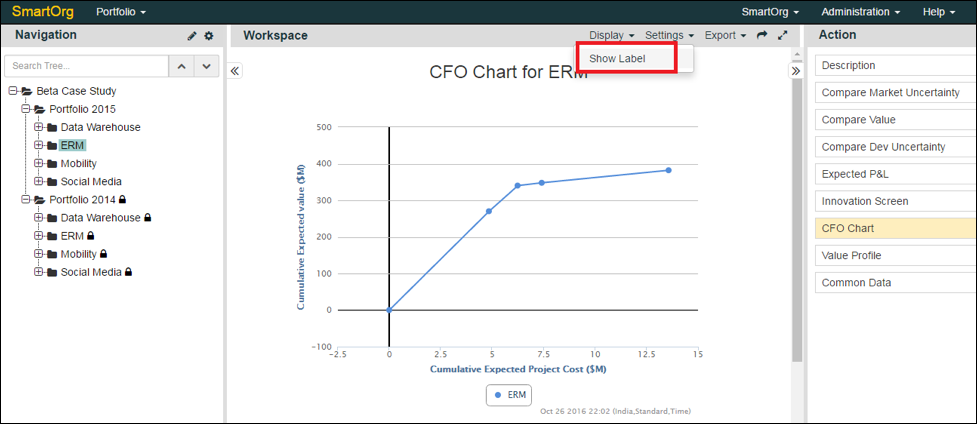
SETTINGS > SHOW LABEL (FOR CFO CHART)
In the CFO Chart Workspace Window, in order to show labels for the projects, you can choose to ‘Show Label’ under the Settings Menu.
The labels will appear at each point in the chart, also allowing you to increase or decrease the number of characters in the label.
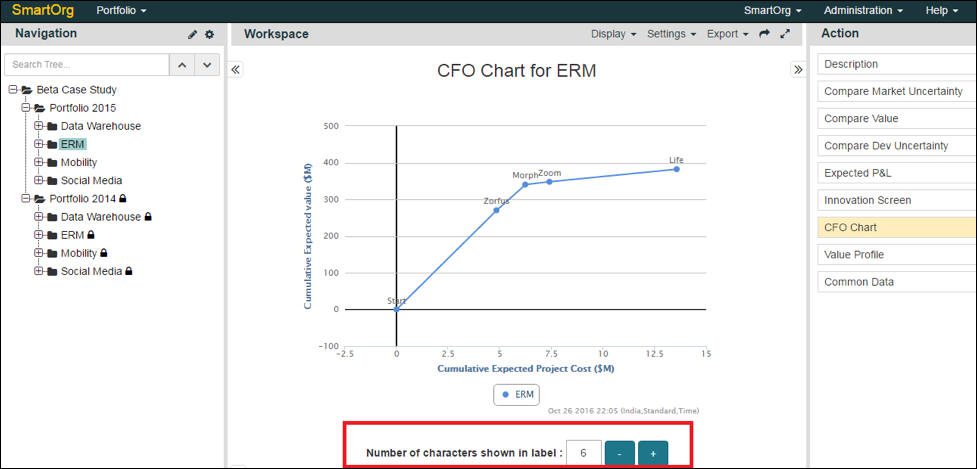
For more information about how CFO chart is used, please refer to STORY OF A CFO CHART.
0 Comments